 Contents:
[more-info]DOWNLOAD THE PRINTABLE FULL MMAT TECHNICAL MANUAL HERE[/more-info]
Executive Summary
This Technical Manual reports on the psychometric properties of the MMAT as evaluated through scores collected from 6868 respondents. Analyses were performed by education, language, ethnicity, English as first language, industry, sex, and country (i.e. UK, Australia). Results support the MMAT as a reliable assessment of general mental ability. Moreover, validity generalisation studies of intelligence tests (i.e. cognitive ability) provide a compelling case for their predictive validity. The analyses reported here show mostly zero to small effects for the categorical variables examined as listed above.
The highest group differences in MMAT mean scores were associated with education level and language. Differences in MMAT scores by education level are to be expected. That is, formal education demands cognitive aptitude, with individuals of higher aptitude likely to achieve higher levels of education. There were also modest differences in mean MMAT scores based on whether test takers had English as their first language.
However, the stability (reliability) of these differences is not well established as the total number of respondents without English as their first language within the total number of MMAT respondents is relatively small. Overall, the results of these analyses support use of the MMAT to help inform human resources selection decisions.
[more-info]Back To Top[/more-info]Description of MMAT
The McQuaig Mental Agility Test (MMAT) is a 15 minute (timed) test of general intelligence, also commonly referred to as cognitive ability, or more simply “g”. It is comprised of 50 multiple- choice formatted questions of verbal comprehension, mathematical ability and reasoning. Decades of research have shown that “g” is one of the strongest and most consistent predictors of performance across different performance metrics, jobs, job levels, occupations, organisations, cultures, and demographics (Bertua, Anderson & Salgado, 2005; Ree, & Carretta, 1998; Salgado, Anderson, Moscoso, Bertua, & de Fruyt, 2003; Schmidt & Hunter, 1998).
This is not surprising, as “g” reflects the ability to understand, synthesize, and process information — critical to learning, problem solving and decision making; as well as to communicating information efficiently and effectively (Gottfredson, 1997; Gottfredson, 2002). Accordingly, tests of “g” have become the mainstay of selection systems worldwide.
[more-info]Back To Top[/more-info]Administration & Scoring
All individuals taking the MMAT are to be given exactly 15 minutes to complete it. Test takers are allowed to use blank sheets of paper to work out solutions, but no calculator. Where the test is administered electronically, safeguards must be in place to ensure that the test is being completed by the person for whom it is intended, that only 15 minutes are allowed, and no calculator or other assistive devices are being used.
Test-takers should be encouraged to try their best to answer as many questions as they can, and be told that: (a) they need not complete the items in order (b); can skip items they find especially difficult or time consuming to answer; (c) they should not expect to complete all 50 items as the test is designed specifically so that very few people are able to do this.
All test takers are to be instructed to work their way through the three sample questions on page 1 of the MMAT before starting the actual test. This is to ensure that the instructions for completing the MMAT are fully understood.
Test takers are also to be assured that their individual test scores will be “safeguarded” (secured, and kept confidential to organisational decision makers alone).
[more-info]Back To Top[/more-info][more-info]DOWNLOAD THE PRINTABLE FULL MMAT TECHNICAL MANUAL HERE[/more-info]
Psychometric Properties:
- Reliability
Reliability refers to the degree to which test scores are free of measurement error. With respect to the MMAT, it is important that differences in test scores among people taking the test reflect differences in levels of “g”, and not error associated with a faulty measure.
Accordingly, if “g” is considered a fairly stable attribute that can distinguish among individuals, then the same person taking the MMAT over two different administrations, separated by time, should obtain roughly the same score. So, if the total scores of individuals at administration time 1 are correlated with their total scores at administration time 2, the correlation should be quite high (i.e. .70 or over). This is referred to as the test-retest reliability.
High test-retest reliability (correlation) coefficients suggest that the MMAT is consistent in its measurement of some individual attribute. This is a desirable characteristic of a test. To illustrate further, imagine if a home food weight scale gave greatly different values for a 1kg of beef each time it is weighed. One would not have much confidence in this scale. Similarly, one would expect a ruler to yield the same metrics each time the length of a single piece of paper is measured. So one of the key requirements of a psychometrically sound assessment of “g” is that it yield consistent measurement, and test-retest reliability is one way to assess this.
Test-retest reliability has been established for the MMAT in a study of 156 university students at Kansas State University conducted by Downey, Wefald and Whitney (2006). The two administrations of the MMAT were separated by 4 weeks, and the test-retest correlation of MMAT scores between the two administrations was .84 — high by professional standards. A test-retest correlation spans from 0 to 1.0, with higher values reflecting higher reliability.
Perhaps not surprisingly, the mean level of performance on the MMAT taken at time 2 was 3.33 points higher than the mean of the MMAT when taken at time 1, suggesting some degree of retention or learning over time. There was no statistical difference in the variance in the distribution of scores at times 1 and 2, suggesting that the MMAT is doing an equally good job of differentiating test takers at both times.
Another means by which to assess the reliability of the MMAT is to split the test in half, perhaps treating all even number items/questions as comprising one half, and all odd numbered items as the other half, then correlating the scores individuals receive on the two halves. High correlations are taken as an index of consistency in responses throughout the test.
Psychometricians have devised a way to obtain a robust and stable measure of the internal reliability of a test by calculating the mean correlation between all possible split halves of the test. This mean correlation is referred to as coefficient alpha, and it can range from 0 to 1.0.
Coefficient alpha was computed for all individuals (619 of 6868) who completed all 50 items of the MMAT (9 percent of test-takers), as drawn from the full MMAT databank as described below (i.e. from the databank of all people tested on the MMAT since its inception). It was .83, well above the .70 mark which is considered acceptable by professional standards (Nunnally, 1970).
- Construct Validity
The focal question surrounding construct validity is: “Does the test measure what it was designed to measure”? The MMAT was designed to measure “g” and so should correlate highly and positively with other well established measures of “g”. Downey et al. (2006) reported a .72 correlation with the Wonderlic (formerly known as the Wonderlic Personnel Test) — another well established measure of “g” widely used in HR selection, first developed in 1936. The .72 correlation between the MMAT and the Wonderlic suggests that the MMAT is measuring “g”. While the MMAT is comprised of items which assess verbal fluency, verbal comprehension, mathematical ability and reasoning, sub-scale scores for these three facets of intelligence should not be used for decision purposes, as the MMAT was designed as a measure of overall “g”. Furthermore, many years of research show that “g” scores are normally distributed throughout the general population, and the MMAT, as will be shown later, produces a near normal distribution of scores across populations on which it was administered.
- Predictive Validity
The predictive validity of any individual assessment refers to how well it predicts what it is intended to predict. As applied to HR selection, predictive validity refers to how well the assessment predicts job performance criteria. Predictive validity is assessed by correlating scores on the assessment tool (e.g. a measure of “g”) with a performance metric. Decades of research have shown “g” to be one of the strongest of the available predictors of success in training and job performance for a variety of occupational groups ranging from retail clerks to skilled worker, to managers and executives, with a mean predictive validity coefficient of approximately .50. Catano, Wiesner & Hackett (2012, p. 323-325) provide an overview of the published reviews of the predictive validity of “g” in employee selection.
The most conclusive reviews on the predictive validity of “g” used “meta-analysis”, which essentially calculates the sample size weighted mean of all correlations between “g” and job performance criteria, corrected for various statistical artifacts, across a large number of studies. In addition to showing that “g” is a strong and reliable predictor of performance metrics across jobs, occupational groups, and job levels, the meta-analyses show that the validities hold up across gender, age groups and nations.
For the seminal meta-analytic reviews, see Schmidt (2002); Schmidt & Hunter (1998); Salgado et al. (2003); Bertua et al. (2005); and Sackett, Borneman & Connelly (2008). Salgado et al.’s (2003) meta-analysis included data from 10 European Community countries that differed in language, culture, religion and social values and found predictive validities that were even stronger than what had been reported for North American samples. Bertua et al.’s (2005) review included 283 studies conducted in the United Kingdom, and found validities ranging from .50 to .60. Collectively, this research suggests that the predictive validity of cognitive ability transcends language and culture and can be used for HR selection in many countries worldwide (cf. Catano, Wiesner & Hackett, 2013).
[more-info]Back To Top[/more-info]Legal Defensibility
Political controversy over the use of measures of general intelligence in employee selection has arisen because studies have consistently shown some minority groups (Blacks, Hispanics) to have lower mean scores on these tests than their non-minority counterparts. Where one group consistently underperforms another in a selection contest, this can result in ‘adverse impact’ – where proportionately more non-minorities are hired than minorities. Where a test is shown to have adverse impact, Canadian and U.S. jurisprudence require employers to show (empirically) that the intelligence test is a ‘bona-fide occupational requirement’ (BFOQ) for the job – that intelligence test scores predict performance-relevant metrics, and that there is no alternative, equally predictive test without adverse impact that could be used to inform selection decisions.
The use of general intelligence measures in employee selection has, to date, consistently met this challenge in both Canadian and U.S. courts (Gottfredson, 1986; Cronshaw, 1986; Terpstra, Mohammed & Kethley, 1999). Further, as pointed out in several of these court cases, any adverse impact associated with using intelligence measures to help inform selection decisions does not equate with ‘test bias’. Bias occurs where predictive validities for a test differ across members of minority versus non-minority groups. There is a large and compelling empirical literature showing that intelligence tests are not biased, (Sackett et al., 2008). There are also several studies showing that, when used with candidate information collected from other selection assessments that have no adverse impact (e.g. structured interviews, personality assessments), the adverse impact associated with tests of “g” is largely diminished when overall selection decisions are derived from a weighted combination of all assessment scores (Cortina, Goldstein, Payne, Davison & Gilliland , 2000; Newman, & Lyon, 2009; Schmitt, Rogers, Chan, Sheppard & Jennings 1997).
The importance of using intelligence tests, such as the MMAT, in employee selection, will increase along with the increasing cognitive demands placed on workers encountering fast- paced, changing environments, where they are required to learn and adapt quickly and make decisions of their own in highly unstructured, dynamic and empowering environments.
[more-info]Back To Top[/more-info]Descriptive Distributional Characteristics for Full MMAT Data Set
All test results on the MMAT were compiled into one large data set, and the descriptive statistics reported below are drawn from this source. The databank as of September 2013 consisted of 6,868 MMAT scores. A detailed breakdown of this population of scores is contained in a supplementary file and available to clients on request. The below distributional characteristics capture categories that allowed interpretable analyses (i.e. cases were collapsed into broader categories as smaller categories did not enable stable results). Percentages as reported below may not add up to exactly 100 due to rounding errors.
- Country
MMAT scores were distributed across 15 different countries, but most were from Australia 3089 (44.98%), UK 1020 (14.85%), Ireland 137 (1.99%), New Zealand 108 (1.57%) and the U.S.94 (1.37%).
- Gender
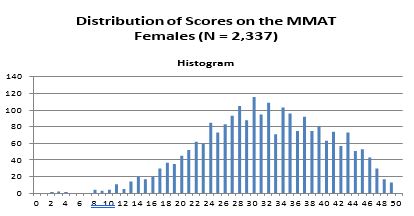
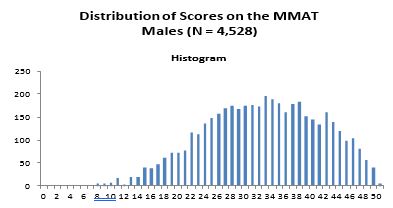
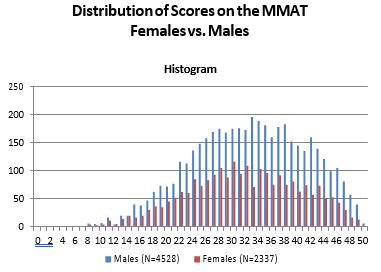
Females comprised 2337 (34%) of the cases, males 4528 (66%) — 3 non reports.
- Education
When asked to report their highest level of formal education, respondents gave a myriad of credentials, including formal degrees, certificates, diplomas, and developmental workshops. Some of these categories contained very few observations, so for ease of interpretation, five larger categories were created as follows: bachelor’s degree 1668, (24.29%); graduate degree (i.e. Master’s level or higher), 1147 (16.70%); post secondary certificate or diploma, 989 (14.40%); and high school diploma, 865 (12.59%). Ninety-Six had reported taking formal education that did not fit within any of the above categories (e.g. attended workshops, part- time courses); and 2103 (30.62%) did not provide information on their educational credentials.
- Regional First language
Six categories best captured “first language” as there were dozens of languages reported, with too few people reporting the same language in many cases to allow for stable analyses. The distribution across the six language categories was: English (4257; 61.98%); European (137; 1.99%); Southeast Asian (131; 1.91%); South Asian (99; 1.44%); Middle Eastern (23; .01%); and “Other” (118; 1.72%). Non-respondents totaled 2103 (30.62%).
- Region
MMAT scores distributed by region were as follows: Australasia 3238 (47.15%); UK 1157 (16.85%); US 94 (1.37%); Asia 60 (.87%); and Europe 24 (.35%). There were 2295 (33.42%) respondents who did not complete the “country” question on the MMAT.
- Ethnicity
Ten ethnic categories were created: Australasian 1875 (27.03%); UK 869 (12.65%); South East Asian (189; 2.75%); South Asian 188 (2.74%); European 151 (2.20%); African 119 (1.73%); North American, 112 (1.63%); Middle East 39 (.57%); South American 26 (.38%); and Other 30 (.45%). Non respondents totalled 3270 (47.61%).
- Industry
MMAT scores were distributed across all main categories of industry: Administrative 1171 (17.05%), Sales, 912 (13.28%); Technology 644 (9.34%); Manufacturing, 404 (5.88%); Service 344, (5.01%); Natural Resources, 323 (4.7%); Education, 209 (3.04%); Healthcare 131 (1.91%); and Other 627 (9.13%). Non respondents totaled 2103 (30.62%).
- Job Level
Job levels were collapsed into five groups: “Employee” 2093 (30.47%); Supervisor/Manager 1878 (27.34%); CIO/CEO 345 (5.02%), Student 225 (3.28%); and Other 224 (3.26%). 2103 (30.62%) did not indicate their job level.
- Job Function
MMAT scores were distributed across seven groupings by job function: Management 295 (4.30%), Sales 178 (2.60%), Administrative support 87 (1.23%), Technical 83 (1.21%), Financial 68 (.99%), Operations 51 (.74%), and “Other” 145 (2.11%); 5961 (86.79%) did not indicate their job function.
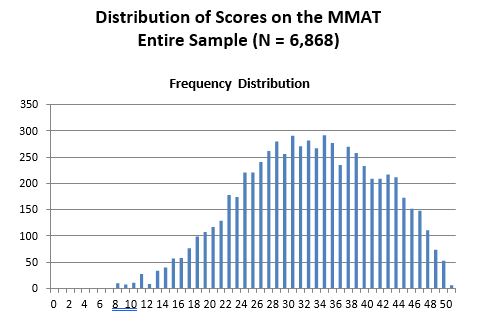
The frequency distribution of the MMAT scores of the entire dataset approximates a normal distribution, as can be seen below. This is consistent with the well established fact that intelligence scores are normally distributed throughout the population. Given the generally high education of this population of test takers, the scores are more highly concentrated in the upper versus lower end of the distribution, with a mean of 32.19 (S.D. = of 8.67). Further, age correlated .007 with MMAT scores (rounded to two decimal points = 0).
An analysis of covariance (ANCOVA) was run to assess whether MMAT scores differed by the categorical groups listed above. Essentially ANCOVA indicates the amount of variance in MMAT scores explained by any one of the categorical variables statistically controlling for the variance in MMAT scores explained by the other categorical variables. So, for example, when looking at whether MMAT scores differ by regional first language, we need to statistically “control” for level of formal education attained (among other variables), otherwise differences by first language could be due to differences in educational attainment between people whose first language is English versus Non-English. ANCOVA manages this statistical control.
Cases contributing to the ANCOVA totaled 4735 (not the entire 6868), as only cases for which complete data were available on all variables were included in the analysis. Because of the large number of cases included in this analysis, all but two of the categorical variables (age and job function) showed statistical significance at p. < .01, which would suggest that MMAT scores differ by each category with the exception of these two. The large number of cases increases statistical power for detecting such differences, such that while statistically significant, differences may not be substantively (i.e. practically) significant. Specifically, the overall ANCOVA test was statistically significant (p < .01), but the entire set of categorical variables explained only 19% of the variance in MMAT scores. Further, five of these variables explained less than 1% of the variance, and only one (education) explained more than 5% (6.8% — a “medium effect” – Cohen, 1992); regional first language accounted for 2.8%, and ethnic group 2.7%.
[more-info]Back To Top[/more-info]Distribution of Mean MMAT Scores for Full Data Set
- Education
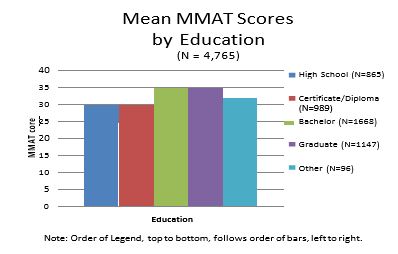
Highest mean MMAT scores were obtained by individuals with a university education: Bachelor’s (34.25, s.d. = 8.20), graduate (34.13, s.d. = 8.70); followed by Certificate/non high school diploma (30.27, s.d. = 7.91), and high school (29.31, s.d. = 8.21).
- Language
Test takers whose mother tongue was English achieved the highest mean MMAT score (33.08, s.d. = 8.30), followed by European (29.35, s.d. = 8.98), South East Asians (26.92, s.d. = 9.00), Middle East (26.91, s.d. = 9.86), South Asians (26.02, s.d. = 8.45) and “Other” (25.95, s.d. = 8.54).
- Ethnicity
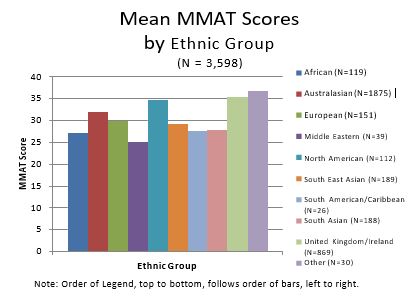
The Mean MMAT scores by ethnic group were as follows: UK (35.45, s.d. = 7.71), North America (34.70, s.d. = 7.74), Australasia (31.98, s.d. = 8.20), European (29.88, s.d. = 8.44), South East Asia (29.13, s.d. = 8.61), South Asia (27.72, s.d. = 8.84), South America (27.62, s.d. = 8.35), Africa (27.07, s.d. = 8.57), and the Middle East (25.00, s.d. = 8.38).
- English versus All Non-English Languages Combined
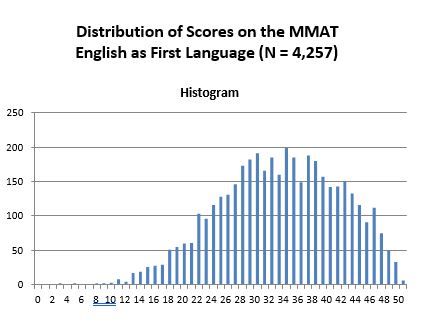
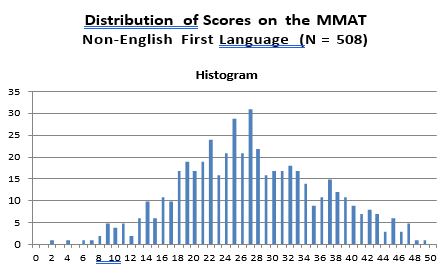
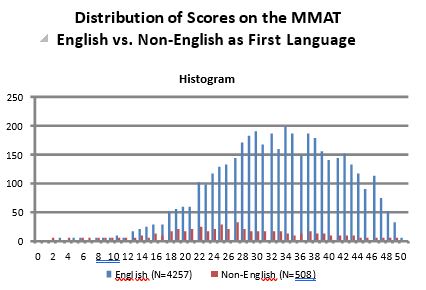
The histogram of MMAT scores obtained from test-takers whose first language was English (N = 4,257) is shown below. The mean MMAT score of these individuals is 33.08 (S.D. = 8.30). In comparison, 508 MMAT test takers for whom English was not their first language obtained a mean MMAT score of 27.17 (s.d. 8.90). Technically differences in mean test scores are not grounds alone to infer that a test is unfairly disadvantageous to one group over the other. The more important issue is whether differences in mean test scores reflect test bias – wherein the scores are not as predictive of performance criteria for one group as compared to the other.The vast majority of studies comparing “g” scores of white Anglo-Saxons with minority groups (e.g. Hispanics, Blacks) have not found evidence of test bias, and therefore employers have largely refrained from making score adjustments (i.e. such as using standardized scores).
Indeed, such score adjustments have been found to be professionally and legally non- defensible (Gottfredson, 1994). Of course, this is a non-issue if MMAT-driven decisions are done within (not across) groups. That is, if MMAT scores are directly compared among all individuals whose mother tongue is other than English, and decisions made with respect to this group of test takers, then differences in mean test scores between groups (English versus Non- English) is irrelevant. Further, with mixed groups, score adjustments for tests of “g” should not be used in the absence of evidence of test bias; and empirical support for such bias in measures of “g” are scant (Sackett et al. 2008).
The distributions of MMAT scores by English and non-English are shown below, followed by a histogram showing mean MMAT scores by regional language.
[more-info]Back To Top[/more-info]
Australia
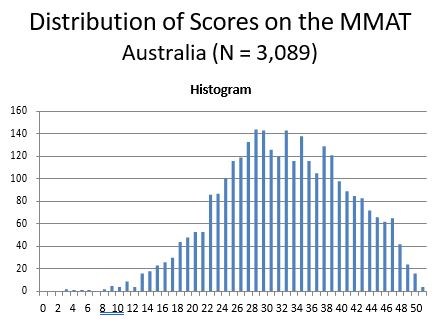 As the single country contributing the most MMAT scores was Australia (3089, 44.74%), separate analyses were performed on this dataset. The distribution of MMAT scores for Australia is normally distributed (Figure 5), with a mean of 31.73, and standard deviation of 8.38.
As with the all-inclusive dataset, an ANCOVA was conducted to assess whether individuals’ standing on one or more of the categorical variables could explain differences in MMAT scores. Once again, very minor differences in mean scores associated with one’s standing within any one of the categorical variables can be statistically, though not substantively, significant with large datasets due to very high statistical power. Effect sizes were statistically significant (p. <
.05) for all but one (age) of the categorical variables. However, the full set of the categorical variables explained only 16 percent of the differences (variance) in MMAT scores.
Not surprisingly, education best predicted differences in MMAT scores, accounting for 8% of the variance. The next most predictive was “first language” (2.1%), followed by industry (1.8%) and ethnicity (1.5%). All the other categorical variables explained less than 1% of the differences (variance) in MMAT scores. As with the all-inclusive data set, these effect sizes are “small” (excepting for education, which is a medium effect; Cohen, 1992), and do not warrant MMAT score adjustments in personnel decisions.
- Education
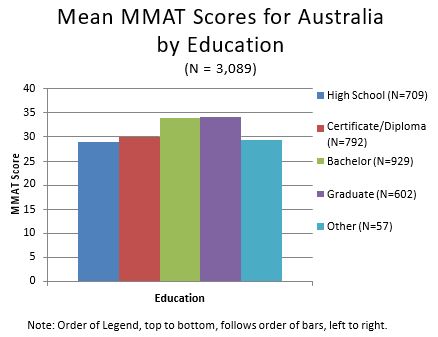
People with graduate education achieved the highest mean MMAT score (34.14, s.d. = 8.60), followed by bachelors degree (33.89, s.d. = 7.89), Certificate/non-high school diploma (30.06, s.d. = 7.73), and high school diploma (28.88, s.d. 8.10).
- Regional Language
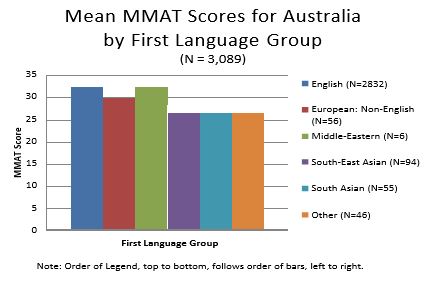
People with English as their first language and
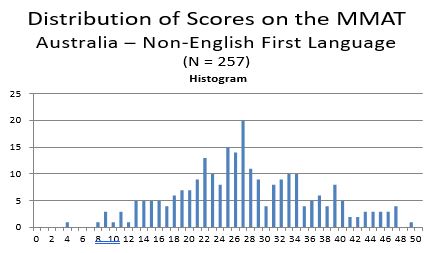
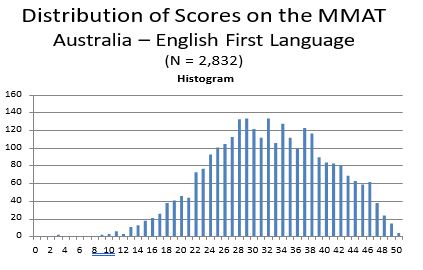
individuals whose first language was based in the Middle East, had the highest mean MMAT score (32.12, s.d. = 8.21; 32.33, s.d. = 10.78, respectively), followed by Europe (29.98, s.d. = 8.71), South East Asia (26.72, s.d. =8.70) and South Asia (26.22, s.d. = 8.99). A histogram showing MMAT score distributions for Australian test takers by language group is shown below, followed by frequency distributions showing MMAT scores separately by English (32.12, s.d. = 8.21) versus Non-English (combined; mean = 27.42, s.d. = 8.95) as first language.
From the frequency distributions it is clear that there is a higher concentration of scores on the right side of the distribution for those whose first language is English; whereas there is a wider spread of scores for their Non-English counterparts. However, the sample size for the Non-English as first language group is relatively small (N=257) compared to the English as first language sample (N = 2,832), so as the former increases it is likely to more closely approximate the MMAT score distribution of the latter; based on the small effect size attributable to language as first language as shown in the ANCOVAs.
- Industry
The highest mean MMAT score was obtained by people from the technology industry (33.69, s.d. = 8.38), followed by education (33.41, s.d. = 8.57), administration (32.60, s.d. = 8.11), health care (32.07, s.d. = 9.01), sales, (30.82, s.d. = 7.94), natural resources (30.18, s.d. = 8.32), and manufacturing (30.07, s.d = 8.28).
- Ethnicity
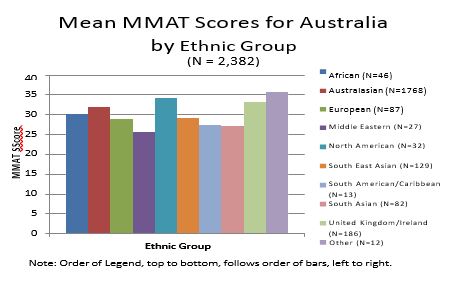
People from North America (34.16, s.d. = 8.04) achieved the highest MMAT mean score, followed by those from the U.K. (33.30, s.d. = 8.13), Australia (31.89, s.d. = 8.23), Africa (30.26, s.d. = 8.29), South East Asia (29.18, s.d. = 8.37), Europe (28.94, s.d. = 8.81), South America (27.46, s.d. = 9.25), South Asia (27.12, s.d. = 8.26), , and Middle East (25.67, s.d. = 8.15).
[more-info]Back To Top[/more-info]United Kingdom
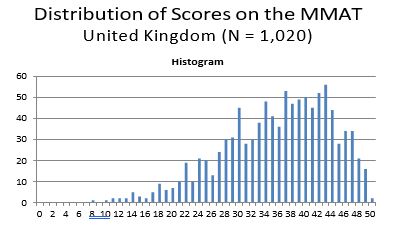
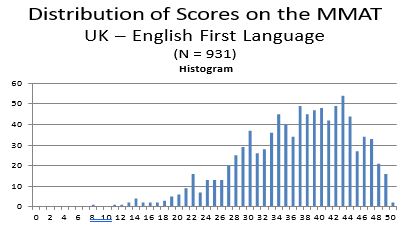
As the single country contributing the second most MMAT scores was the UK 1020 (14.79%), separate analyses were performed on this dataset as well. The distribution of MMAT scores for the U.K. is normally distributed (Figure 8), with a mean of 35.75, and standard deviation of 8.09.
As with the all-inclusive dataset, an ANCOVA was conducted to assess whether individuals’ standing on one or more of the categorical variables could explain differences in MMAT scores. Once again, very minor differences in scores associated with one’s standing within any one of the categorical variables can be statistically, though not substantively, significant with large datasets because of very high statistical power. Effect sizes were significant (p. < .05) for all but three of the categorical variables (age, job function and job level). However, the full set of the categorical variables explained only 17 percent of the differences (variance) in MMAT scores.
Ethnicity best predicted differences in MMAT scores, accounting for 6.1% of the variance, followed by language (6.0%), education (2.7%), sex (2.0%), and industry (1.8%) – all are small effects with the exception of ethnicity and language, which are medium effect sizes (Cohen, 1992). The effect of ethnicity is likely due to that category consisting of a large predominance of people within the U.K. with English as their first language.
- Ethnicity
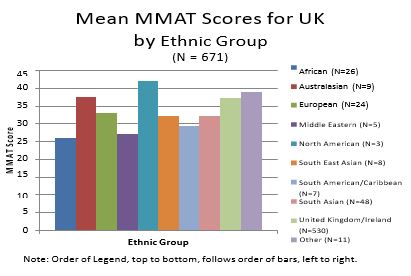
North Americans achieved the highest mean MMAT score (42.00, s.d. = 1.73), followed by individuals from Australasia (37.44, s.d. = 6.89), the U.K. (37.18, s.d. = 7.11), Europeans (33.12, s.d. = 6.39), South Asians (32.19, s.d. = 9.05), South East Asians (32.13, s.d. = 12.32), South Americans (29.29, s.d. = 7.48), the Middle East (27.20, s.d. = 10.99), and Africans (26.08, s.d. = 7.79).
- Regional Language
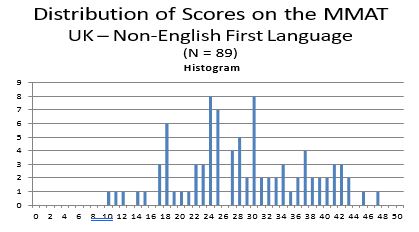
Individuals whose first language was English achieved the highest MMAT mean score (36.44, s.d. = 7.71), followed by South East Asians (32.33, s.d. = 11.86), Europeans (31.22, s.d. = 7.11), South Asians (26.82, s.d. = 8.73), and people from the Middle East (24.67, s.d. = 11.86). When all non-English as first language groups are combined, their mean MMAT score is 28.76 (s.d. = 8.54). The difference in mean MMAT scores between English as first language versus English not first language (i.e. 7.68) may not be stable because the size of the latter group was a mere 89.
As with the Australian sample, the statistical effect for language in the ANCOVA is of medium size, and therefore it is quite likely that as the number of UK test takers whose mother tongue is other than English grows that the distributions of test scores and means for the two groups will more closely converge. Note that a simple display of mean MMAT scores by language does not control for differences in the other categorical variables (e.g. education, job level).
- Education
Again, people with a university education had higher mean MMAT scores than others: Bachelor’s (36.34, s.d. = 7.90), graduate (35.49, s.d. = 8.40), certificate/diploma (34.77, s.d. = 7.82) and high school (34.10, s.d. = 8.13).
- Gender
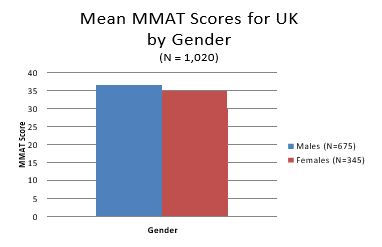
Males achieved a mean MMAT score of 36.45 (s.d. = 7.82) compared to females (34.38, s.d. = 8.44). This difference does not take into consideration differences in the two groups on any of the other categorical variables, so the difference could be due to differences between the two groups in education (or any other of the categorical variables). With the statistical controls employed in the ANCOVAs the effect associated with gender is very small, and not substantively significant.
- Industry
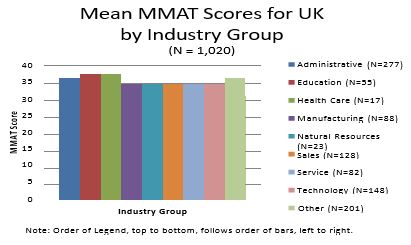
Highest mean MMAT scores were obtained by people from health care (37.82, s.d. = 6.04), followed by education (37.05 s.d. = 7.54), administration (36.22, s.d. = 8.27), manufacturing (35.35, s.d. = 6.84), technology (35.04, s.d. = 8.47), service (34.82, s.d. = 8.40), natural resources (34.65, s.d. = 8.63), and sales, (34.23, s.d. = 8.05).
[more-info]Back To Top[/more-info]Summary Comments on Mean MMAT Differences by Categorical Variable
The vast majority of the category-based statistically significant differences in mean MMAT scores were small, predicting less than 1% of the variance. Statistical significance was found due mostly to the large number of cases contributing to each analysis, which enhances the statistical power of the tests. Statistical significance does not equate with substantive significance (e.g. practical meaningfulness). It simply means that the results obtained (of small effects) are likely replicable in future administrations of the MMAT.
Further, interactions effects were also investigated, looking at the effects associated with combinations of the categorical variables. When these interaction terms are added to the analysis, all main effects drop below 1% (meaning that 99% of the differences in MMAT scores are unrelated to the categorical variable studied here). Moreover, the strongest interaction effect was 2%. Because these interaction effects were so small, they are not reported in the body of this technical manual. However, results of all statistical analyses, including these tests for interaction effects, are contained in the Statistical Supplement to this manual.
The largest MMAT mean differences consistent throughout the above sets of analyses were related to education and language, though the effects sizes, as shown in the ANCOVAs were of moderate size (statistically speaking). The differences associated with education could be explained in that individuals with higher cognitive ability or intelligence are more likely to pursue advanced education and do well in meeting the cognitive demands of advanced programs. As for language, the medium size effect could be associated with the English content of the MMAT questions, but also due to the smaller sample sizes of non-English as first language test takers when compared to their English-as-first-language comparator group.
It is important to note that the differences in mean MMAT scores between the English versus Non- English as first language reported throughout this manual do not take into consideration differences between the two groups on the other categorical variables, and when statistical controls are employed through the ANCOVAs, the effects sizes attributable to language are modest. The issue of language can be best addressed through translating the MMAT into other languages, where there is a large enough pool of test-takers requiring a translated version to make this economically viable. This would enable studies comparing MMAT test results between versions (English; Non-English mother tongue) taken by a single sample.
[more-info]Back To Top[/more-info]Conclusion
The data analysis and other published studies on the use of intelligence tests for employee selection support the continuing use of the MMAT for this purpose.
Specifically, the findings reported herein show the MMAT as having reliability and construct validity. Moreover, validity generalisation studies of intelligence tests (i.e. cognitive ability) provide a compelling case for the predictive validity of such tests. Finally, the findings here show mostly zero to small effects for the categorical variables examined, with the highest of the effects associated with education and language.
Of course, many jobs require the knowledge and skills that come with the attainment of formal educational requirements, so it would be inappropriate to make score adjustments for education. Also, many jobs require a working command of the English language, suggesting that it may be inappropriate to make score adjustments on that variable as well. Still, even if a working knowledge of English is not required in a job, adjustments for language are still not recommended, as the mean MMAT score difference between English as first language and English not as first language, is based on a relatively small sample of the latter group.
Furthermore, such adjustments are not supported by professional standards, empirical studies, or U.S. jurisprudence (Gottfredson, 1994). Indeed, they are explicitly prohibited under Section 106 of the U.S. Civil Rights Act of 1991 (Miller, McIntire, & Lovler, 2011).
[more-info]Back To Top[/more-info]References
Acquinis, H., Culpepper, S.A. & Pierce, C.A. (2010). Revival of test bias in preemployment testing. Journal of Applied Psychology, 95:4, 648-80.
Bertua, C., Anderson, N., Salgado, J.F. (2005). The predictive ability of cognitive ability tests: A UK meta-analysis. Journal of Occupational and Organizational Psychology, 78:387-409.
Catano, V.M., Wiesner, W.H. & Hackett, R.D. (2012). Recruitment and Selection in Canada, Fifth Edition, Nelson Education Ltd., Toronto, Ontario, Canada.
Cohen, J. (1992). A power primer. Psychological Bulletin, 112:1, 155-159.
Cortina, J.M., Goldstein, N.B., Payne, S.C. Davison, H.K. & Gilliland, S.W. (2000). The incremental validity of interview scores over and above cognitive ability and conscientiousness measures. Personnel Psychology 53: 325-51.
Cronshaw, S.F. (1986). The status of employment testing in Canada: A review and evaluation of theory and professional practice. Canadian Psychology, 27:2, 183-195.
Downey, R.G., Wefald, A.J., & Whitney, D.E. (2006; Feb. 20). Investigation of the test-retest reliability and construct validity of the McQuaig Occupational Test. Report submitted to the McQuaig Institute.
Gottfredson, L. (1986). Societal consequences of the g factor in employment. Journal of Vocational Behavior, 29:379-411.
Gottfredson, L.S. (1994). The science and politics of race-norming. American Psychologist, 49:11, 955-963.
Gottfredson, L. (1997). Why g matters: The complexity of everyday life. Intelligence, 24:79-132.
Gottfredson, L. (2002). Where and Why g matters: not a mystery. Human Performance, 15:25- 46.
Miller, L.A., McIntire, S.A. & Lovler, R.L. (2011). Foundations of Psychological Testing: A practical approach. Sage, Publications Inc., Thousand Oaks, California, p. 50.
Newman, D.A. & Lyon, J.S. (2009). Recruitment efforts to reduce adverse impact: Targeted recruiting for personality, cognitive ability and diversity. Journal of Applied Psychology, 94:2, 298-317.
Nunally, Jr., J.C. (1970). Introduction to psychological measurement, New York, NY, US: McGraw-Hill.
Ree, M.J. & Carretta, T.R. (1998). General cognitive ability and occupational performance. In C.L. Cooper and I.T. Robertson, Eds, International Review of Industrial and Organizational Psychology, Vol. 13: London: John Wiley and Sons, 159-184.
Sackett, P.R., Borneman, M.J. & Connelly, B.S. (2008). High –stakes testing in higher education and employment: Appraising the evidence for validity and fairness. American Psychologist, 63:4, 215-227.
Salgado, J.F., Anderson, N., Moscoso, S. Bertua, M.C. & de Fruyt F. (2003). International validity generalization of GMA and cognitive abilities: A European communities meta-analysis. Personnel Psychology, 56: 573-605.
Schmidt, F.L. (2002). The role of general cognitive ability and job performance: Why there cannot be a debate. Human Performance, 15:187-210.
Schmidt, F.L., & Hunter, J.E. (1998). The validity and utility of selection methods in Personnel Psychology: Practical and theoretical implications of 85 years of research findings. Psychological Bulletin, 124:262-74.
Schmitt, N.A., Rogers, W., Chan, D., Sheppard, L. & Jennings, D. (1997). Adverse impact and predictive efficiency of various predictor combinations. Journal of Applied Psychology, 82: 719- 30.
Terpstra, D.E., Mohammed, A.A. & Kethley, R. (1999). An analysis of federal court cases involving nine selection devices. International Journal of Selection and Assessment 7:26-34.
[more-info]Back To Top[/more-info]Autobiographical Sketch of Rick D. Hackett, Ph.D.
Rick D. Hackett is Professor and Canada Research Chair in Management of Organisational Behaviour and Human Performance at the DeGroote School of Business, McMaster University. He served as Editor-in-Chief of the Canadian Journal of Administrative Sciences from January 2006 to December 2011 and serves on the editorial board of the Journal of Organisational Behaviour. Currently he is Associate Editor of the Journal of Business & Psychology.
Professor Hackett is also Past-President of the Canadian Society for Industrial-Organisational Psychology (CSIOP) of the Canadian Psychological Association, a professional association of approximately 300 Canadian industrial-organisational psychologists. He is co-author of “Recruitment and Selection in Canada” (5th Edition), published by Nelson Education Limited, the top selling book on the topic in Canada. From 2005-2011 he served on the Professional Standards Committee of the Canadian Council of Human Resources Association (HRPA); and from 1992-93 he was a member of the Working Group on Test Publishing Industry Standards, Professional Standards Committee of the Canadian Psychological Association.
Over the past 30 years Professor Hackett has provided consulting services on psychometric assessment and selection to myriad private and public sector organisations.
[more-info]DOWNLOAD THE PRINTABLE FULL MMAT TECHNICAL MANUAL HERE[/more-info] [more-info]Back To Top[/more-info]

